To determine a city’s affordability, housing costs cannot be viewed in a vacuum. Transportation costs are also a major factor, according to a new policy brief, Location Affordability in Large U.S. Cities: Variability among Types of Households, from the Citizens Budget Commission (CBC) in New York City. A sign of transportation’s importance is the frequent trade-off between housing and commuting costs. A resident may be willing to ante up for a more expensive apartment to be closer to his or her job and spend less time and money commuting.
CBC uses the combination of housing costs and transportation costs, called “location affordability,” to determine the residential competitiveness of major American cities. It uses a Location Affordability Index, developed by the U.S. Department of Housing and Urban Development (HUD), to measure these two costs. HUD suggests that households paying more than 45 percent of their income for housing and transportation cannot afford the place they live.
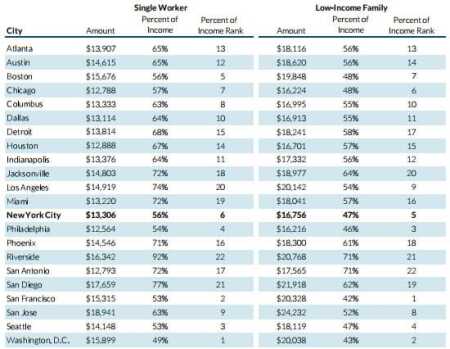
Using this 45 percent threshold, CBC found that all 22 large cities analyzed are affordable for all households that are moderate and middle income or higher. But it is a different story for low-income households. Only San Francisco (42 percent of the threshold) and the District of Columbia (43 percent) are affordable for a low-income family, and then barely. As for a lower-income single worker (i.e., at the midpoint of median income in the region), none of the cities is affordable.

Combined Housing and Transportation Costs, Percent of Income, and Percent of Income Rank for Low-Income Household Group, Selected Cities, 2010. Source: U.S. Department of Housing and Urban Development, Location Affordability Portal - Version 1 (accessed July 12, 2014), www.locationaffordability.info/lai.aspx.
Comparing location costs for low-income families in San Francisco and San Jose, California, where such families’ household income is roughly the same, underscores the impact of transportation expenses on affordability. Although housing costs for low-income families in San Francisco ($14,036) are nearly as high as those in San Jose ($14,912), they have much lower transportation costs ($6,292 vs. $9,320), making San Francisco a much better deal.
Not surprisingly, single households hovering around the national poverty line are in the deepest trouble. They require more than 100 percent of their income for location costs in every city but Philadelphia (95 percent). Granted, this does not take into account government subsidies such as food stamps, housing vouchers, and earned income tax credits.
The report examines costs for seven kinds of rental households, ranging from dual-income to a low-income family, which cover a range of income levels. (Only renters were studied; homeowners were excluded because affordability is less of an issue for them and homeownership benefits like the mortgage interest deduction complicate affordability calculations.) For each type of household, income, rent, and transportation costs are set or estimated by HUD. CBC notes that the cost figures are statistical constructs rather than averages for actual households in the cities.
Location costs in New York City proved a surprise. “Everybody thinks we’re either best or the worst on everything and . . . people thought we were worst in terms of affordability,” says Charles Brecher, co–research director at CBC and a coauthor of the report.
New York ranks higher than most of the other 21 U.S. cities for all four types of households studied that are middle income or higher. New York ranks second for a retiree household (whose location costs amount to 31 percent of income), third for a moderate-income household (37 percent), fourth for a dual-income family (27 percent), and sixth for a single professional household (34 percent).
New York’s advantage lies in a subway system that blankets the city and its robust regional mass transit system. “Everyone says it’s expensive to live here,” says senior research associate and report coauthor Rahul Jain, who points out that in New York few people bear the expense of car ownership. High incomes in New York combine with the low cost of getting around to make the city relatively affordable. Location costs in New York for a typical household are 32 percent of income, the third lowest among the 22 cities.
Another surprise was provided by Los Angeles. “Most people are surprised to learn that the L.A. metro area is the second-densest metro area in the nation,” says Michael Dardia, CBC’s co–research director. “Not only does that conflict with the image of L.A. as the epitome of suburban sprawl, but it is an example of why using ‘density’ as a proxy for transit options is misguided. Despite its density, L.A. has relatively poor mass transit.”
Indeed, Los Angeles does not fare well in location affordability, ranking ninth for low-income families and 21st for single professionals.
“HUD recently updated their database in ways that could affect CBC’s specific rankings,” notes Michelle Winters, a visiting senior fellow at ULI’s Terwilliger Center for Housing. Still, she says, the point of CBC’s report—“transportation costs vary significantly from place to place and do fundamentally affect the affordability of housing in a particular location”—remains true. Including transportation costs in affordability, she says, “helps us at least level the playing field between areas that have different housing costs.”
Winters adds that CBC’s study is unusual in two respects. One, it compared location costs across different metropolitan areas. So far, she notes, the HUD location affordability data has mainly been used to look at how affordability varies within a particular metropolitan area, such as between central city and suburban housing. Second, often economic analyses “focus on a generic median income household,” she says. “They are so general they’re not very helpful.” By contrast, HUD ”went a step further,” she says, breaking a city’s populace into household types and looking at the situation of each.
But including transportation costs is not enough, Winters continues. Energy costs also vary from home to home and can be a major expense. When people are weighing where to live, she says, “It’s important to consider all these costs in looking at your options.”


