The Chicago-based nonprofit Center for Neighborhood Technology (CNT) and New York City–based TransitCenter unveiled an interactive transit tool in April that maps the access, quality, and use of transit across 371 cities in the United States.
AllTransit is foremost a transit tool, offering insights on urban connectivity, access, and transit service by aggregating and mapping data from 805 transit agencies, 15,070 routes, and 543,787 bus and rail stops nationwide. It has the potential to be used in a variety of applications, such as helping businesses make location decisions. It also has a loftier goal: to drive value at a socioeconomic level by identifying accessibility to jobs, health care facilities, and other services, such as car- and bike-sharing programs.
The release of the transit tool comes at a time when “smart” traffic tools are moving to the forefront for cities. Cities are rethinking transit and mobility amid changing demographics and population growth that is putting more strain on the existing traffic grid, said Randy Bowman, assistant public service director for Columbus, Ohio, and a lead on the city’s Smart Columbus program.
Columbus has been named one of seven finalists in the U.S. Department of Transportation’s Smart City Challenge. DOT has pledged up to $40 million—subject to appropriations—to one city to help it define what it means to be a “smart city” and become the first U.S. city to fully integrate innovative technologies, such as self-driving cars and smart sensors, into its transportation network.
An important theme for cities is providing robust choices for people because not everyone has the same travel needs, says Bowman. The challenge is to use technology to seamlessly match transit choices so people can move from one mode of transportation to another, he adds.
“I think that kind of information is really, really an asset in smart decision making,” says Denny Zane, executive director at Move LA, a transit advocacy group in Los Angeles. It also allows individuals to look at where they want to live within a city such as Los Angeles—where they can have access to jobs and other services and amenities that are important to them, he adds.
CNT has been working with transit data for more than a decade through research that expanded nationally when it started developing its Housing and Transportation Affordability Index several years ago.
“We really wanted to understand—how does transit play a role in reducing the transportation costs for residents, how does that vary from place to place, and how can people depend more on transit and reduce their reliance on automobiles,” says Linda Young, CNT director of research and project management.
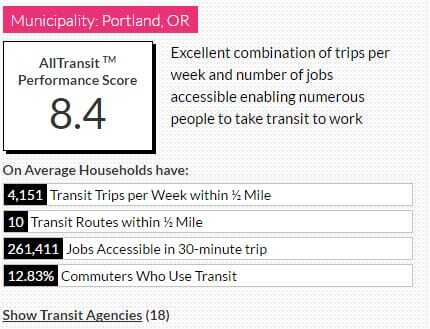
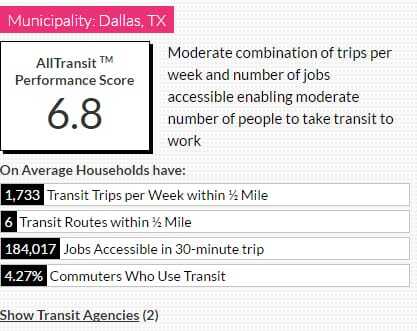
The AllTransit dashboard provides both detailed information and a snapshot of key data points that include an overall performance score and average data related to four key points:
- The number of transit trips per week within a half mile (0.8 km);
- the number of transit routes within a half mile;
- jobs accessible within a 30-minute trip; and
- percentage of commuters in the search area who use transit.
As an example, Portland, Oregon, has an AllTransit score of 8.4 percent. Data show that average households in the city have access to ten transit routes within a half mile, 261,411 jobs are accessible within a 30-minute trip, and 13 percent of commuters use transit.
Users of the tool also can look at a particular neighborhood. Portland’s Pearl District has an AllTransit score of 9.6: the average household has access to 42 transit routes, 380,754 jobs are accessible within a 30-minute trip, and 16 percent of commuters use transit.
“What makes our transit score different is the availability of transit, where does it go, and are people using it,” says Peter Haas, chief research scientist at CNT. “I think there are a lot of opportunities for this transit score to show how well transit serves the people and how well they are using it.”
Users seeking more detail can click on tabs that link to dozens of different research metrics related to six topic areas—jobs, economy, health, transit equity, transit quality, and mobility network. For example, a user could use the mapping feature to evaluate proximity and access to a particular type of job, car-sharing and bike-sharing locations, and farmers markets—all in conjunction with the transit routes and stops in a particular area.
CNT and TransitCenter are already planning for additional ways to enhance AllTransit. One step is to allow users to compare transit access in relation to housing—such as the location of properties offering low-income housing tax credits or other affordable housing options—for use in research reports and planning.
“This is just the beginning. We started with this set of metrics, and we plan to expand this going forward and look at other metrics and other categories,” says Young.


