In private-capital multifamily, sellers’ conditions were influential across markets; the office sector experience varied widely across geographies.
At least since 2020, macroeconomic factors have made it challenging to assess the values of different asset classes. The combination of post-pandemic recovery, tighter monetary policy, and the degree of work-from-home persistence have created an uncertain market environment where it is harder to identify solid market trends.
This article compares the activity in the private-capital deal market for assets in the $5 to $25 million range in 2022 relative to 2021, using recent data compiled by Green Street. The Real Estate Alert’s Broker Rankings Report contains, among other things, the total dollar value and the number of transactions for different asset classes by geographic market in those two years. I focus on trends in multifamily and office classes, which have garnered significant attention amid the tectonic shifts induced by the emergence of work from home. This comparison can shed some light on local conditions in a context of considerable uncertainty about the fate of different cities and regions.
The last two years were markedly different from each other. While 2021 was a year of low interest rates, with the U.S. economy recovering from pandemic-induced disruptions, 2022 has seen the U.S. Federal Reserve initiate a rapid monetary policy tightening cycle, with the consequent increase in medium and long-run rates. Further, work-from-home trends are only recently beginning to stabilize. Despite these significant differences in macroeconomic conditions, the national-level data suggest minimal changes in total activity for multifamily and office classes year-over-year. The total value of deals remained stable, with approximately $25 billion for about 2,300 transactions in multifamily and $15 billion for about 1,500 transactions in the office sector. However, examining individual cities reveals distinct patterns in behavior.
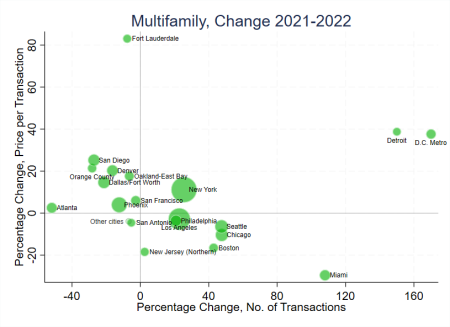
Figure 1 shows a scatter plot of the 2021-2022 percentage changes in the average transaction price (vertical axis) against the number of transactions (horizontal axis) for the multifamily class. The size of each marker (except for “Other cities”) is proportional to the value of all deals in 2022.
Consider a place like Boston, in the South-East quadrant. Higher current and expected interest rates depress the demand for assets and reduce the price each buyer is willing to pay. If this were the entire story, however, we would also see a reduction in the number of transactions occurring in this market: fewer current owners would be willing to sell at lower prices. Instead, we see an increase in the number of transactions. One way to explain this joint movement in prices and transaction volumes is that potential sellers are more willing to accept a lower price than they used to—that is, the supply of properties to the market might have increased despite the lower demand. Many cities experienced this behavior in 2022, including Los Angeles, Philadelphia, and Miami.
Cities in the northwest quadrant corroborate the suggestion that supply factors primarily shape the cross-city multifamily landscape. In places like San Diego, Orange County, or Phoenix, prices are increasing year-over-year. The contemporaneous reduction in the number of transactions is consistent with sellers holding on to their properties and taking them off the market, thus shrinking supply. If this were not the case, we would likely see more transactions rather than fewer. These two quadrants account for over 70% of transaction values in 2022, indicating that owners’ behavior appears to have been an essential determinant of the overall multifamily trends.
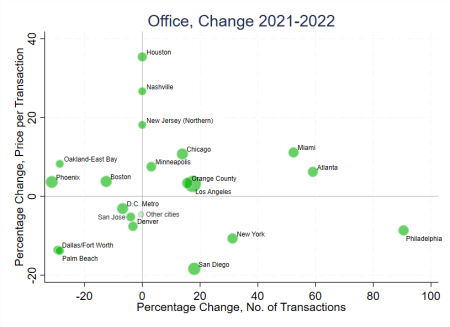
The analysis of office properties in Figure 2 indicates a more diverse experience across cities.
Supply factors appear dominant in places like New York or San Diego (where owners seem willing to accept lower prices) or Oakland (where, on the net, supply to the market appears to be shrinking). However, these two quadrants only accounted for around 40 percent of the total transaction values in the graph in 2022. In many cities, buyers’ prospects appear to have shaped the market more. In cities like Dallas, for example, prices and transactions are jointly falling, which is consistent with a dominating effect of lower demand for office properties. In places like Chicago or Miami, average prices have grown along with the number of transactions, suggesting—if anything—that operators retained confidence in these assets. There seems to be no “typical” office market experience nationally. This variety of behaviors might partially reflect diverse expectations about the prospect of the office sector across different cities. It might also be a consequence of the composition of loan maturity and the heterogeneous impacts of rising interest rates, aspects discussed in this Urban Land recent article by Beth Mattson-Tieg.
A caveat to this analysis is that there is significant variation in property quality within and across markets, and trends across quality levels have been different and may be changing. Also, market conditions are still in rapid evolution. There are indications that the latest quarter of 2022 has seen a much more rapid drop in activity, as the same Green Street report suggests. More in general, the recent turmoil in the banking sector has added uncertainty to a rising path of interest rates that had already significantly impacted lending and deal closure, as discussed with great clarity by John B. Levy.


